Top 5 Chart Visualization Techniques for Technical Analysis
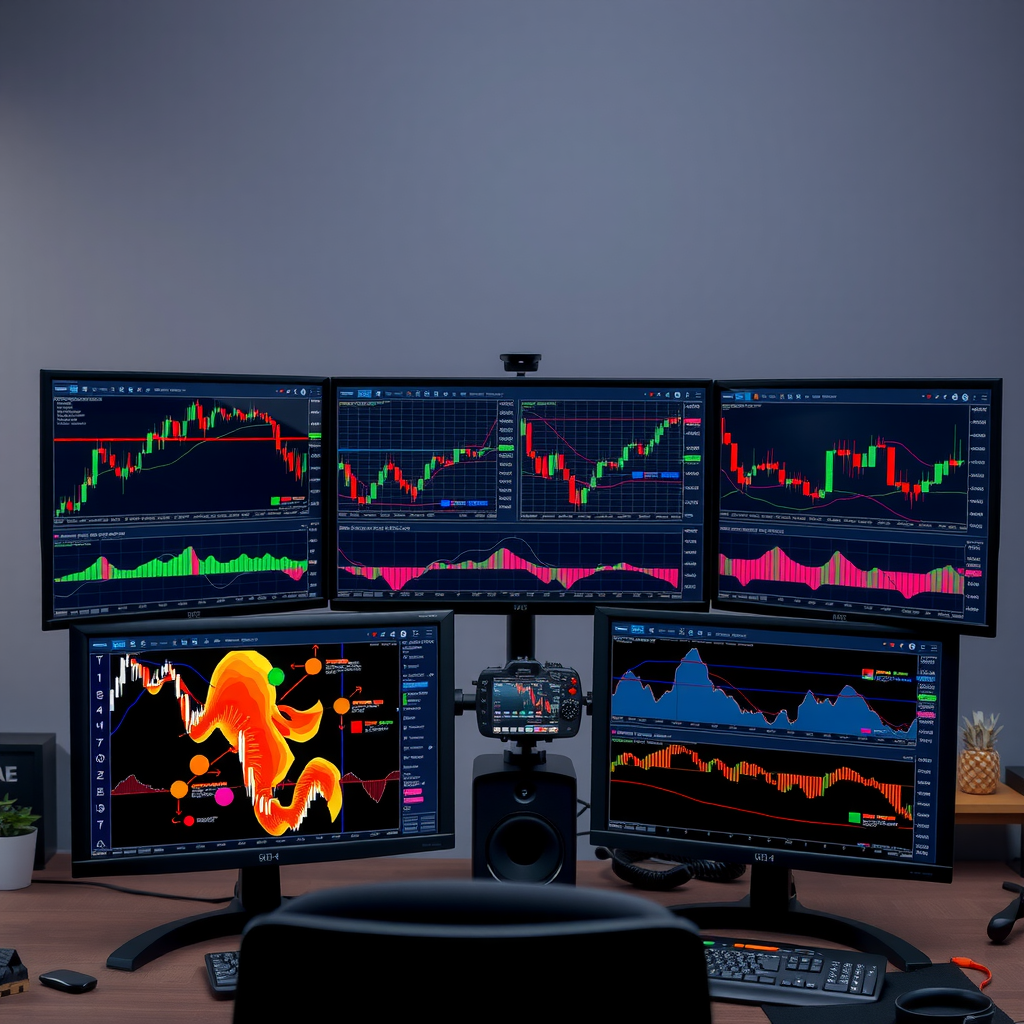
Mastering chart visualization is essential for professional traders who need to make informed decisions quickly. The right visualization techniques can reveal patterns, trends, and opportunities that might otherwise remain hidden in raw market data. This comprehensive guide explores five powerful chart visualization methods that will enhance your technical analysis capabilities.
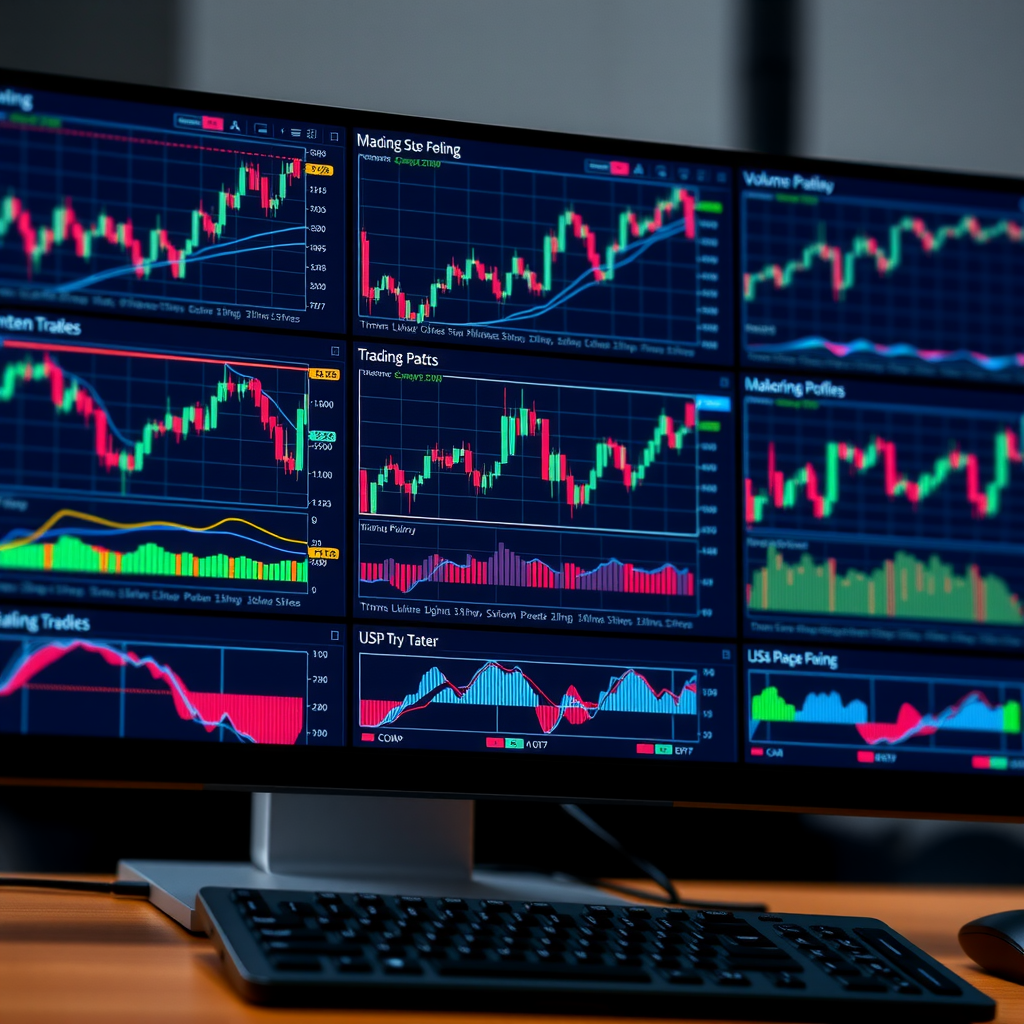
1. Candlestick Pattern Recognition
Candlestick charts remain the foundation of technical analysis, providing a visual representation of price action that reveals market sentiment and potential reversals. Understanding how to properly configure and interpret candlestick patterns is crucial for effective TradingView chart monitoring and analysis.
Key Candlestick Patterns to Monitor
- Doji Patterns:Indicate market indecision and potential trend reversals. Configure your platform to highlight these formations with color overlays.
- Engulfing Patterns:Bullish and bearish engulfing candles signal strong momentum shifts. Set up alerts for these high-probability setups.
- Hammer and Shooting Star:These reversal patterns work best when combined with support and resistance levels.
- Three White Soldiers/Black Crows:Strong continuation patterns that indicate sustained directional movement.
Implementation Tip
Most monitoring platforms allow you to customize candlestick colors. Use contrasting colors for bullish (green: #00bcd4) and bearish (red: #ff6b35) candles to improve pattern recognition speed. Enable body and wick highlighting for better visibility of price action details.

2. Volume Profile Analysis
Volume profiling transforms traditional volume bars into a horizontal histogram that shows trading activity at specific price levels. This technique reveals areas of high liquidity, support, and resistance that aren't visible on standard charts.
Setting Up Volume Profile Visualization
To implement volume profile analysis effectively:
- Access Volume Profile Tools:Navigate to your platform's indicator library and select "Volume Profile" or "Volume by Price" indicators.
- Configure Time Periods:Set the analysis period to match your trading timeframe. Day traders should use session-based profiles, while swing traders benefit from weekly or monthly profiles.
- Identify Point of Control (POC):The POC represents the price level with the highest traded volume and often acts as a magnet for price action.
- Mark Value Areas:The value area contains 70% of the trading volume and defines the fair value range for the asset.
- Customize Colors:Use gradient colors to distinguish between high-volume nodes (darker shades) and low-volume nodes (lighter shades).
Key Insight
Volume profile analysis is particularly powerful when combined with price action. Areas where price moves quickly through low-volume nodes often indicate strong directional moves, while high-volume nodes act as support or resistance zones.
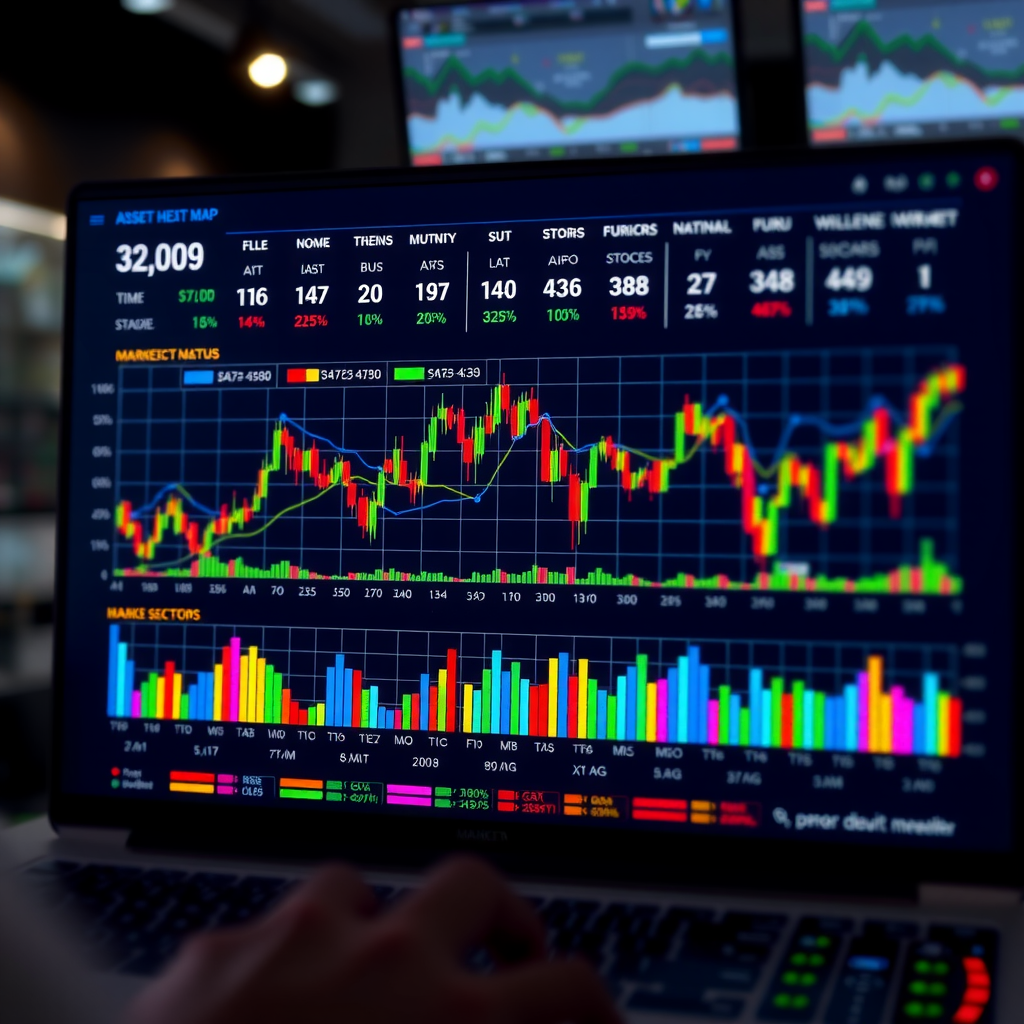
3. Heat Map Visualization
Heat maps provide an intuitive way to visualize market strength, volatility, and correlation across multiple assets simultaneously. This technique is essential for portfolio monitoring and identifying sector rotations.
Types of Heat Maps for Trading
- Performance Heat Maps:Display percentage changes across assets using color gradients from red (negative) to green (positive).
- Volatility Heat Maps:Show relative volatility levels to identify high-risk and low-risk opportunities.
- Correlation Heat Maps:Reveal relationships between different assets, helping with diversification and hedging strategies.
- Order Flow Heat Maps:Visualize bid-ask spreads and order book depth for short-term trading decisions.
Configuring Heat Map Settings
For optimal heat map visualization:
- Select a color scheme that provides clear contrast (avoid red-green for accessibility)
- Set appropriate thresholds for color transitions based on your trading strategy
- Enable real-time updates to capture market movements as they happen
- Group assets by sector, market cap, or custom categories for better organization
- Add tooltips that display detailed metrics on hover for quick reference
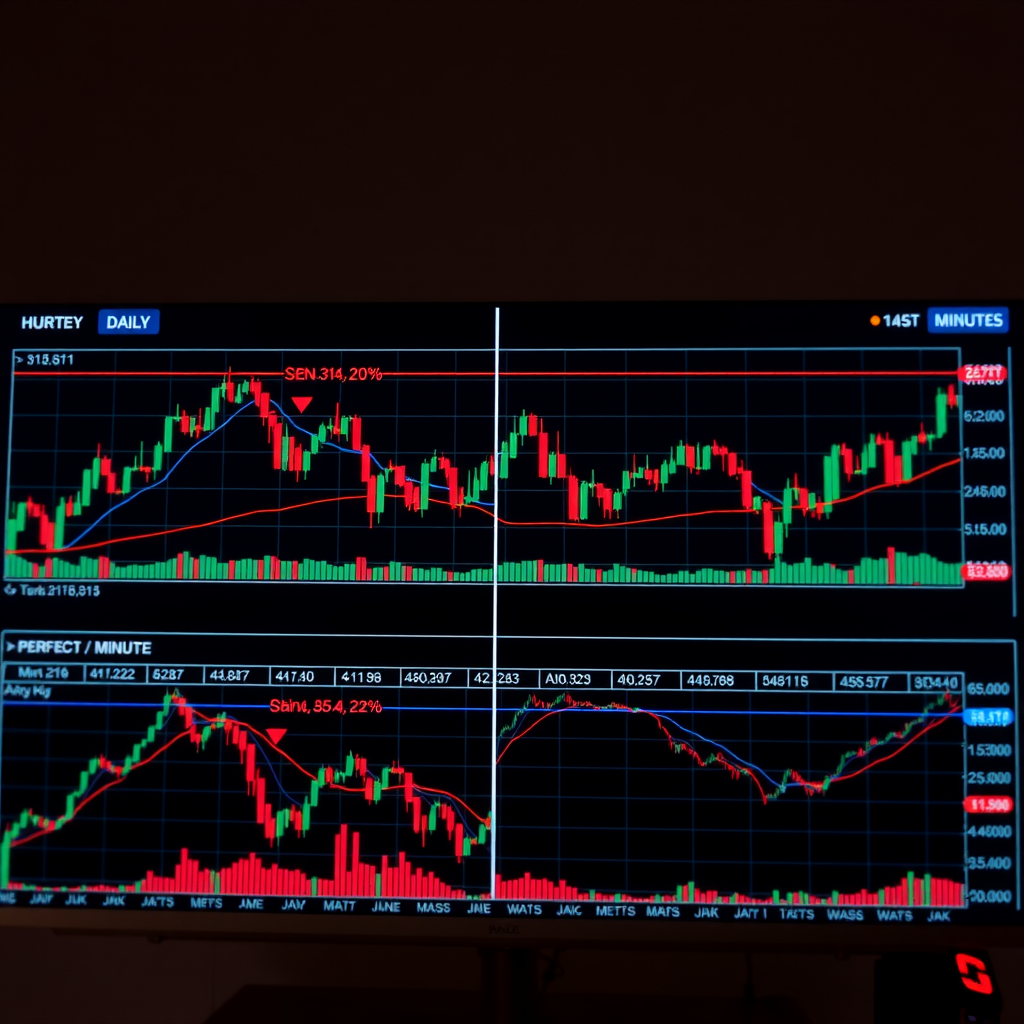
4. Multi-Timeframe Analysis
Multi-timeframe analysis involves viewing the same asset across different time periods simultaneously. This technique provides context for short-term moves within longer-term trends, significantly improving trade timing and risk management.
Optimal Timeframe Combinations
Professional traders typically use a three-timeframe approach:
Day Trading Setup
- Higher Timeframe:Daily chart for overall trend direction
- Trading Timeframe:15-minute or 1-hour chart for entry signals
- Lower Timeframe:1-minute or 5-minute chart for precise entries
Swing Trading Setup
- Higher Timeframe:Weekly chart for major trend identification
- Trading Timeframe:Daily chart for setup confirmation
- Lower Timeframe:4-hour chart for entry timing
Implementation Steps
- Create Chart Layouts:Most monitoring platforms allow you to save custom layouts with multiple charts. Create templates for different trading strategies.
- Synchronize Indicators:Apply the same technical indicators across all timeframes with consistent settings for easier comparison.
- Mark Key Levels:Draw support, resistance, and trend lines on the higher timeframe, then observe how price reacts to these levels on lower timeframes.
- Use Color Coding:Assign different background colors or border styles to each timeframe for quick visual identification.
- Enable Cross-Hair Sync:Link the crosshair tool across all charts to analyze the same moment in time across different timeframes.
Pro Strategy
The "top-down" approach is most effective: start with the highest timeframe to identify the overall trend, move to the middle timeframe to find potential setups, and use the lowest timeframe for precise entry and exit points. Never trade against the higher timeframe trend.
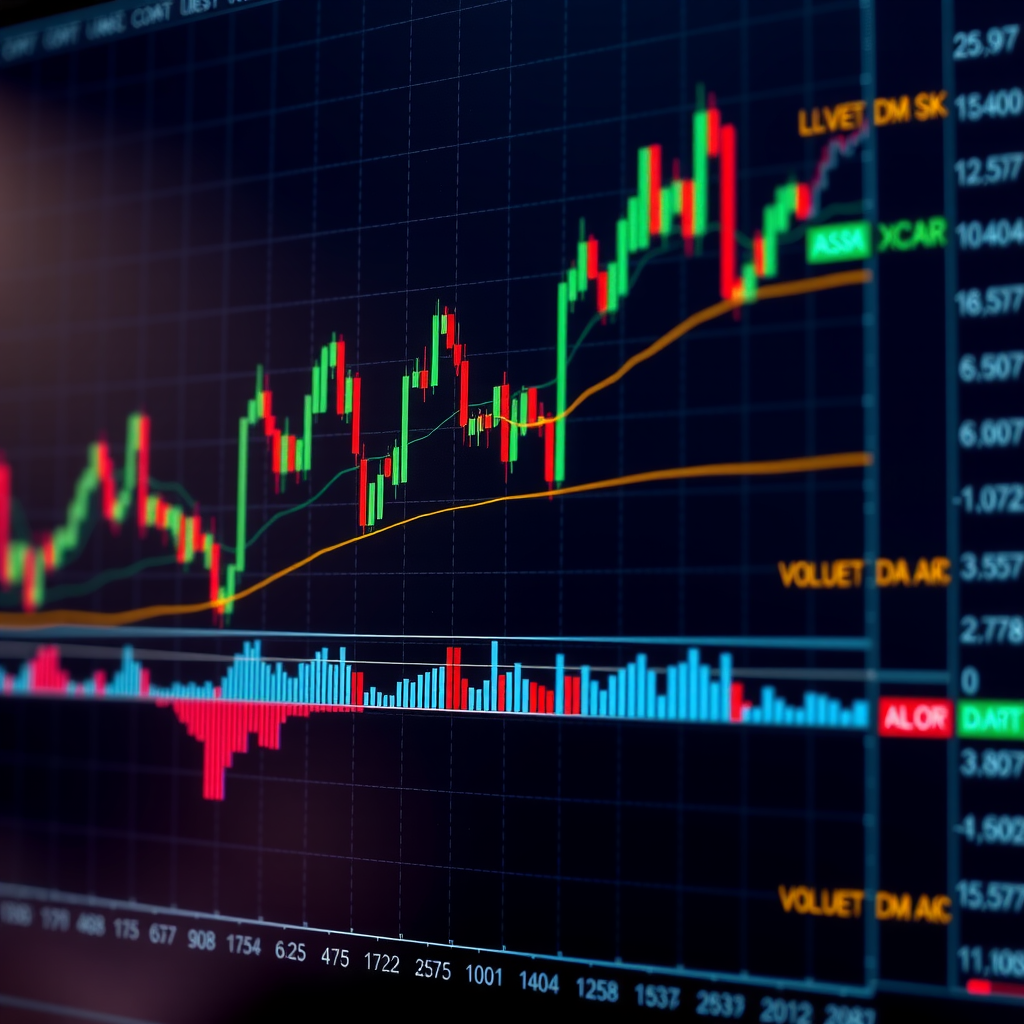
5. Custom Indicator Overlays
Custom indicator overlays allow you to combine multiple technical indicators into a single, comprehensive visualization. This technique reduces chart clutter while providing all the information needed for informed trading decisions.
Popular Indicator Combinations
- Trend + Momentum:Combine moving averages with RSI or MACD to identify trending markets with strong momentum.
- Support/Resistance + Volume:Overlay Fibonacci retracements with volume profile to find high-probability reversal zones.
- Volatility + Trend:Use Bollinger Bands with ADX to trade breakouts in trending markets.
- Multiple Moving Averages:Create a "ribbon" effect with 8-12 EMAs to visualize trend strength and potential reversals.
Building Custom Overlays
To create effective custom indicator overlays:
- Start with a Base Indicator:Choose your primary indicator based on your trading strategy (trend-following, mean reversion, etc.).
- Add Complementary Indicators:Layer additional indicators that provide different types of information (momentum, volume, volatility).
- Adjust Transparency:Use opacity settings to prevent overlapping indicators from obscuring each other. Set primary indicators to 100% opacity and secondary ones to 50-70%.
- Color Coordination:Use a consistent color scheme that makes it easy to distinguish between different indicator types at a glance.
- Create Alert Conditions:Set up automated alerts when multiple indicators align, signaling high-probability trading opportunities.
Example: Comprehensive Trend Trading Overlay
- 20, 50, and 200-period EMAs (blue gradient) for trend identification
- RSI (14) in separate panel with 30/70 levels marked
- Volume bars with moving average overlay (teal for above average, gray for below)
- ATR-based stop loss levels (red dashed lines)
- Support/resistance zones (semi-transparent rectangles)
Optimization Tips
- Limit overlays to 3-5 indicators to avoid analysis paralysis
- Test different parameter settings on historical data before live trading
- Save multiple overlay templates for different market conditions
- Regularly review and update your overlays based on performance results
- Use indicator alerts to notify you when all conditions align for a trade
Warning
Avoid "indicator overload" – using too many indicators can lead to conflicting signals and decision paralysis. Focus on a core set of complementary indicators that work well together and align with your trading strategy.
Implementing These Techniques in Your Platform
Most modern monitoring platforms support all five visualization techniques discussed in this guide. Here's a step-by-step approach to implementing them:
Platform Configuration Checklist
- Chart Type Selection:Set candlestick charts as your default chart type for optimal pattern recognition.
- Volume Profile Setup:Add volume profile indicators to your favorites for quick access across all charts.
- Heat Map Integration:Create a dedicated workspace or tab for heat map views of your watchlist.
- Multi-Timeframe Layouts:Design and save chart layouts for different trading styles (scalping, day trading, swing trading).
- Custom Indicator Library:Build a personal library of indicator combinations that match your trading strategy.
- Alert Configuration:Set up alerts for key technical levels and indicator signals across all visualization types.
- Color Scheme Standardization:Apply consistent colors across all charts for faster visual processing.
Performance Optimization
To ensure your visualization setup runs smoothly:
- Limit the number of simultaneously displayed charts to 4-6 to prevent system lag
- Use lower resolution settings for secondary timeframes that don't require detailed analysis
- Close unused workspaces and clear cache regularly
- Disable auto-refresh on charts you're not actively monitoring
- Consider using a dedicated monitor for heat maps and watchlists
Conclusion
Mastering these five chart visualization techniques will significantly enhance your technical analysis capabilities and trading performance. Candlestick pattern recognition provides the foundation for understanding price action, while volume profile analysis reveals hidden support and resistance levels. Heat maps offer a bird's-eye view of market conditions, multi-timeframe analysis provides essential context, and custom indicator overlays bring everything together in a comprehensive visualization system.
The key to success is not just implementing these techniques, but customizing them to match your specific trading style and market focus. Start by mastering one technique at a time, then gradually integrate additional visualization methods as you become comfortable with each one. Remember that effective chart visualization is about clarity and actionable insights, not complexity for its own sake.
Take the time to properly configure your monitoring platform, experiment with different settings, and continuously refine your approach based on real trading results. With practice and dedication, these visualization techniques will become second nature, allowing you to make faster, more confident trading decisions backed by comprehensive market analysis.
Next Steps
Begin implementing these visualization techniques today by starting with candlestick pattern recognition and volume profile analysis. As you gain confidence, add multi-timeframe analysis to your workflow, then incorporate heat maps and custom indicator overlays. Document your setup process and track which combinations work best for your trading strategy.